This guide was created on 2022-07-03 by Slazanger while in Pandemic Horde.
I thought it would be useful to post a how-to guide for setting up SMT and a quick overview of its features.
Installing
The latest release is always available on github : https://github.com/Slazanger/SMT/releases
Download the zipfile SMT_<version>.zip (currently SMT_1.11.zip), and then extract the zipfile somewhere.
It runs on .netcore so you need the runtimes, if you don’t have those installed you can grab them here : https://dotnet.microsoft.com/en-us/download/dotnet/6.0 you need the .Net Desktop 6.xx Runtime and the .Net Runtime 6.xx.
Running
Run the file “SMT.exe” from the extracted folder.. nice and simple
Adding Characters
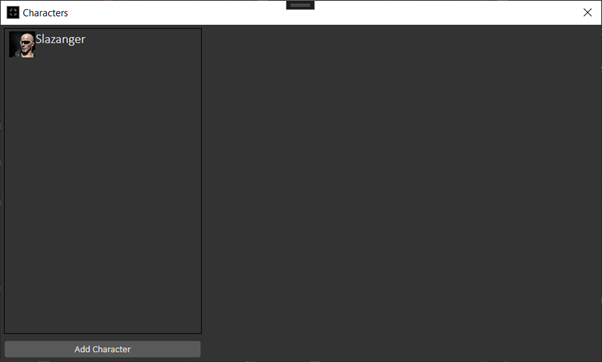
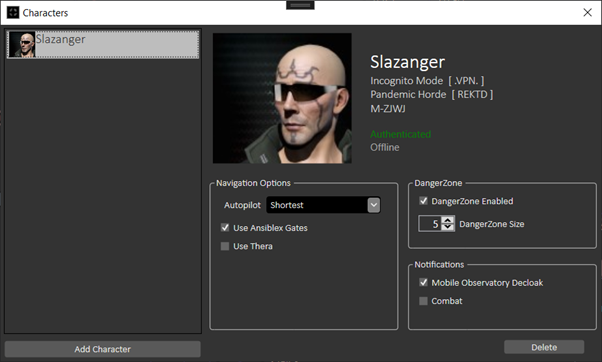
A lot of the functionality is locked behind ESI and as such you need to authenticate your characters.. to do this open the characters menu (File -> Characters) and click the Add character in the bottom left :
This will open a browser to allow you to log in and when working will say Authenticated..
A brief overview
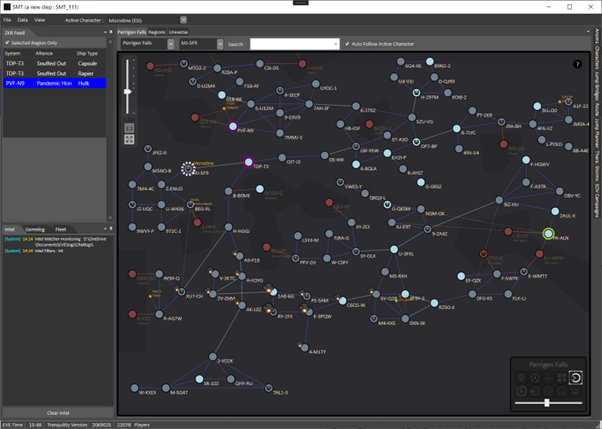
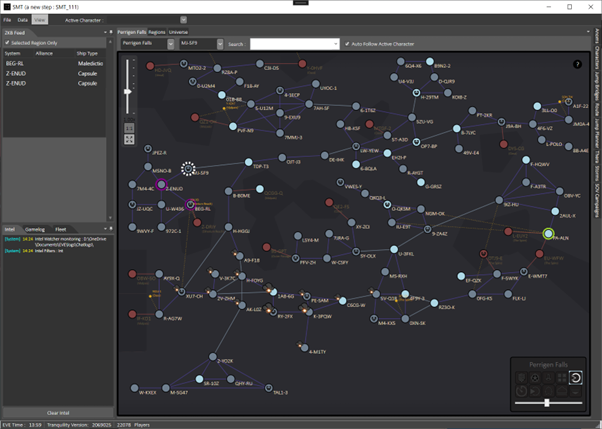
There are currently 3 main views, the regions, the dotlan style view and the universe view; on the left are panels for Zkill at the top (this is a feed of the live intel from zkill) and underneath the gamelog, intel and fleet. On the right are 8 minimised panels : Anoms, Characters, Jump Bridges, Route, Jump Planner, Thera, Storms and SOV campaigns
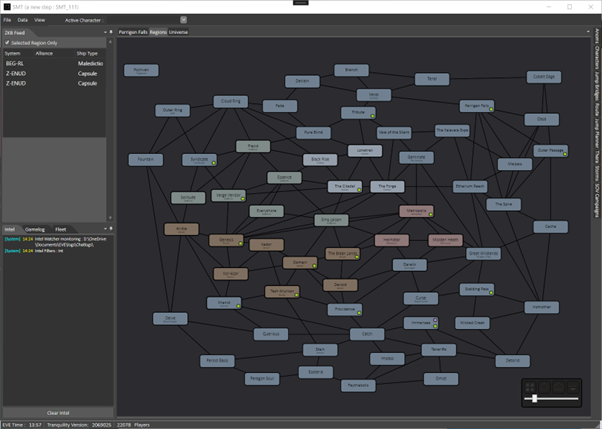
Regions view
On this view you have the basic high level regions with some additional items; the green dots represent a thera connection, the pink(ish) represent a character, theres also a toolbar bottom left which will show the aggregated stats for standings for the active character, pod kills, ship kills and rat kills.
You can double click on any region to switch to that view
Region Specific View:
This is the dotlan style view showing the systems in the selected region a brief legend : (you can also click on the ? in the top right
- Circle = System
- Square = System with NPC station
- Green Highlight = Thera connection in system
- Clouds = Metaliminal Storm
- Brown highlight = Incursion
- Dotted yellow lines = jump bridges
- Strange Icon in system = Jove Observatory in system (its the jove icon..)
- Triangle = Edencom/Trig invasion system
- Purple Circle = Zkillboard activity (the larger the circle the more activity)
- = Point of interest
In the bottom right is a toolbar which you can use to enable various data layers ontop of the map
Top Row left to right :
- ADMs (if you want to see system ADMS’s)
- System Security : Coloured using the in game representation from -1.0 to +1.0
- Sov Owners : Shows the owning alliance ticker and key
- Show Standings : Colours the map based on the standings related to the current active character
- Jump Gates: Shows the current imported jump gate
Bottom Row left to right :
- Show Timers : highlights system that are currently vulnerable, or will soon be vunerable (defaults to next 30 mins)
- Jumps in the last hour (larger circle = more jumps)
- Pod kills in the last hour (larger circle = more pod kills)
- Ship kills in the last hour (larger circle = more ship kills)
- Rat kills in the last hour (larger circle = more ratting)
And last row is a slider which is a scale to help you scale up and down the various data circles
- Other bits and pieces, you can right click on systems to bring up zkill/dotlan or show various range maps, you can also have range maps tied to characters by using the auto jump range when you right click on characters
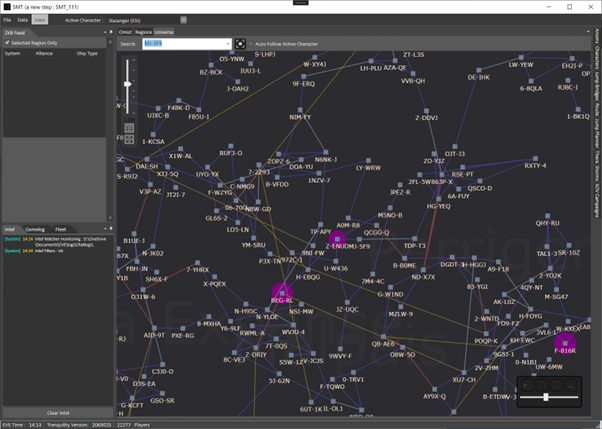
The Universe View
This is a flattened, slightly separated view of the 3d universe useful for either planning moves or other cross region items; it has a similar set of data overlays (zkill = purple, and then the tool bar bottom right).
You can also right click on these to show jump ranges; which will draw a guide circle and highlight any in range.. if you have multiple overlays it will additionally highlight any within range of both.
Setup for Ratting
First up add your characters as above
Next ensure you’re in the in-game intel channel (Bean-Intel)
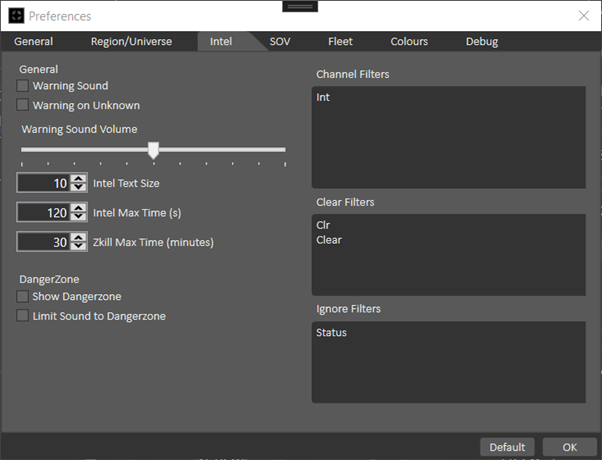
Check the intel filters are setup correctly.. if you haven’t changed them then it should just work [tm] however SMT doesn’t monitor all channels, only those which match a particular text pattern. To check this in the preferences (File -> Preferences) under intel check that the channel filters contain Int
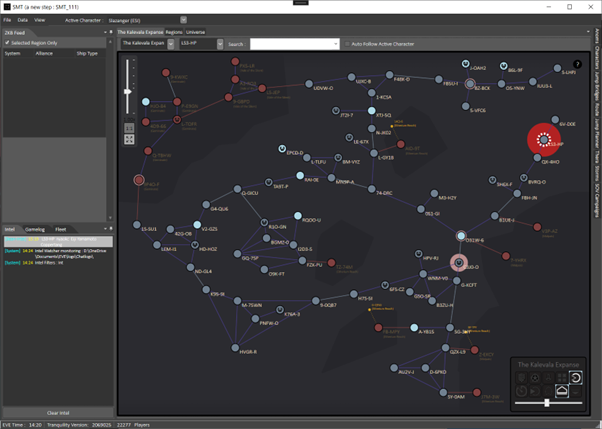
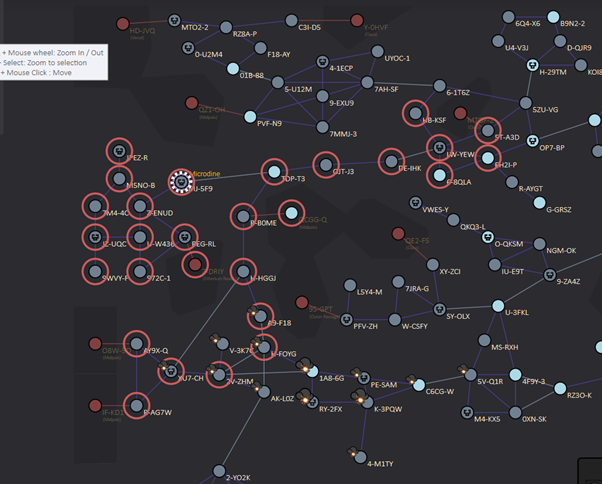
If its working you will start to see the intel in the panel on the left and red circles appear:
The circles will slowly shrink away over 2 minutes (by default), if someone reports it as clear they will turn yellow.
If you want it to play an alarm then you have 2 options to enable :
Warning Sound : this will play a wooop sound when intel is reported in a system
Warning on Unknown : if the intel doesn’t contain a system, this will play a sound.
The DangerZone!
If intel is too much, which it can be with such a large channel, you can enable the Dangerzone.. what this is is an area around your character to limit the sound to.
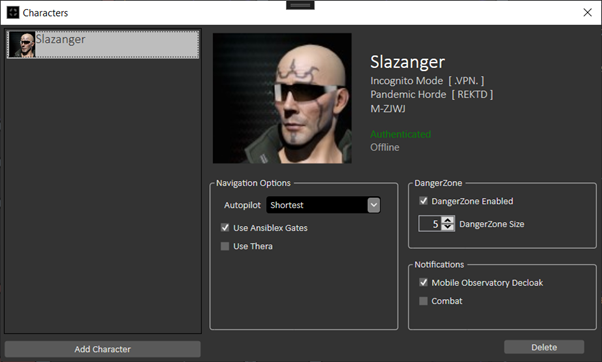
First Enable the Limit Sound to Dangerzone option in the intel part of the preferences then for every character you want intel for, you need to enable it and configure its size.. this is done in the characters screen with :
- DangerZone Enabled :
- DangerZone Size : (this is the number of jumps out from the character you’re interested in intel alarms)
If you want a visual representation of the dangerzone in the intel preferences you can enable the show dangerzone and it will draw an additional ring around each system which will trigger an alarm when intel is reported
Setup for Hunting
Screw ratting, lets hunt them.. This is how I recommend setting up things for hunting ratters.
First up configure the region specific view :
- Enable the System security
- Enable the Ratting kills in the last hour
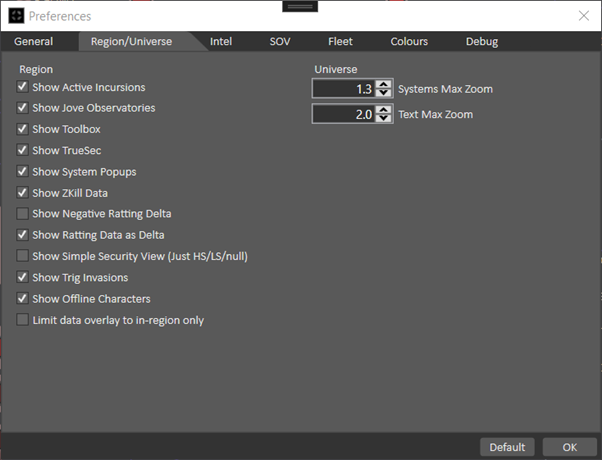
Next set some of the additional options in the preferences under region/universe :
Specifically Make sure :
- Show Truesec is enabled
- Show Negative Ratting Data is disabled
- Show Ratting data as Delta is enabled
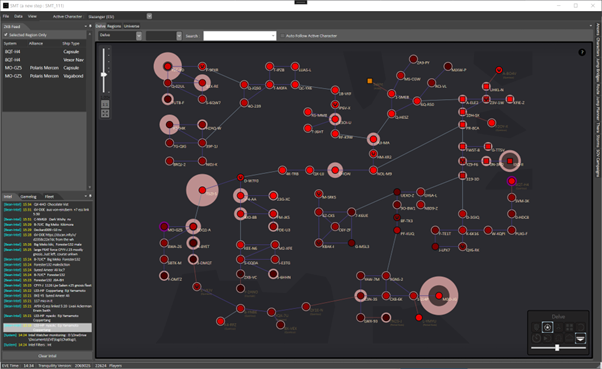
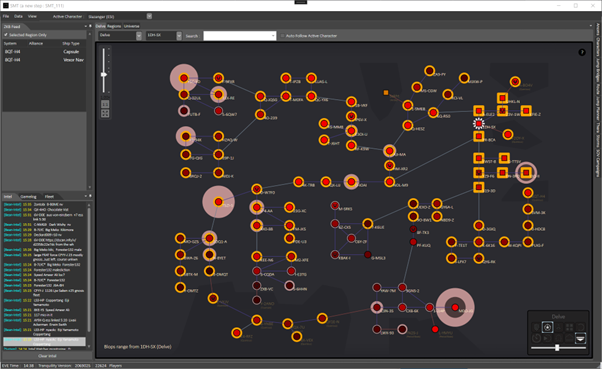
This should give you a view like this :
The systems are now tinted closer to black the closer they are to true-sec.. these are the usual ratting or mining hotspots.
The overlay now shows 2 bits of data, the pinkish big circle is the number of rats killed in the last hour, however some also have an additional dark grey circle.. these are systems that have a positive delta.. these are candidate systems for finding ratters..
If your hunting with blops you can also enable a range view.. either right click on your starting system, or character within it eg if for example the blops and bombers are in 1-DH you could show the range map to highlight systems in range
Setup Jump Bridges
Now the awkward bit.. Jump bridges.. I used to have a search which was *somewhat* reliable.. about 2 years ago CCP completely screwed it with a couple of bugs.. the api gives me structures back which are dead, and tells me they are alive so now we need to get jump gate date manually :
- Open the Structure Browser in-game Select “Jump Bridges” and “Region”, make sure all services are deselected. (Always do a whole region at a time.)
- Create a new chat channel for yourself Drag and drop the first structure into the chat window as if you were linking it Hit enter and repeat for every single jump bridge in that region
- Right click and “Copy All” Paste the list in a rich text editor (VS Code or Sublime Text are both good)
you can then copy this text and on the jump bridges tab import them from clipboard (i recommend clearing beforehand)..
If you want to share these you can click export and it will create a text file
tldr version:
- Pull down the most recent TXT into Notepad, etc.
- In Notepad Ctrl-A, Ctrl-C to get the list into Clipboard
- Open SMT > File > Preferences > New Structures
- Look for Ansiblex Gates panel
- Click the button "Clear Gates"
- Click the button "Import from Clipboard"
- You will see From / To filled out in the listbox
- Click "OK"
Linux Setup from Yuddhisthira
For the rare few out there running on Linux, I just got SMT working pretty well using Bottles. https://usebottles.com/ Here's a brief guide on what I did.
- Download SMT from https://github.com/Slazanger/SMT/releases - I used the zip file ending with "_Setup.zip", which has an installer file that simplifies setup. Unzip this file so you have access to SMT_Setup.msi.
- In Bottles, create a new bottle using the "Application" environment. Click on the bottle, then click "Dependencies". Install the dotnetcoredesktop6 and allfonts dependencies.
- In the bottle details screen, look for the button in the upper right that has three vertical dots (the "seconday menu") and then click "Browse Files". This should open your file browser pointing to the directory containing the files for the bottle. Copy in the SMT_Setup.msi file from wherever you unzipped it earlier (doesn't really matter where you put it).
- Back in the bottle details screen, click "Legacy Wine Tools" and then "Explorer". This should open a file explorer inside the bottle. Find the SMT_Setup.msi file and double-click to install, using whatever choices you prefer (I just went with the defaults).
- Back in the bottle details again, click the three vertical dots and then click "Search for new programs". There should now be an "SMT" entry under "Programs". Clicking on it should bring up SMT, but you may need some other setting changes if it doesn't work (see below).
Once SMT is installed, you'll need to configure Bottles to add a Windows drive to get access to your EVE log files. This is under "Settings", "Compatibility", "Manage Drives". I added an E: drive pointing to "~/.steam/debian-installation/steamapps/compatdata/8500/pfx/drive_c/users/steamuser/Documents/EVE", which you may need to adjust (try "find ~/.steam -name EVE" to find the directory if you're running via Steam). Note: if you're running Bottles via Flatpak you'll need to run this to grant access to your ~/.steam directory: "flatpak override --user com.usebottles.bottles --filesystem=~/.steam".
Now inside SMT go to "File", "Preferences", "General" and click "Set custom log folder". Change it to E:\logs (or wherever you chose earlier) and then restart SMT. If all went well, you should start seeing intel reports in the "Intel" pane in the lower left.
If SMT doesn't run:
- try enabling "Discrete Graphics" in the bottle display settings. It didn't work for me without this, maybe because my Nvidia settings are set to use the GPU all the time.
- try changing the "Runner" value - the default runner "soda-8.0-2" didn't seem to work for me, but "sys-wine-9.0" works well (I assume this is using the version of Wine I already had installed at the system level). You can try different runners by installing them under Preferences from the main Bottles screen.
- I haven't double-checked that the dotnetcoredesktop6 dependency mentioned earlier is exactly what SMT needs - if not, try downloading and installing the .NET Desktop Runtime from here https://download.visualstudio.microsoft.com/download/pr/d0849e66-227d-40f7-8f7b-c3f7dfe51f43/37f8a04ab7ff94db7f20d3c598dc4d74/windowsdesktop-runtime-6.0.29-win-x64.exe
Good luck!

