Difference between revisions of "File:HF Payout.png"
From EVE University Wiki
Size of this preview: 800 × 501 pixels. Other resolutions: 320 × 200 pixels | 1,838 × 1,151 pixels.
Original file (1,838 × 1,151 pixels, file size: 142 KB, MIME type: image/png)
m (Fix category.) |
Mednik Breau (talk | contribs) (→Summary: added "Python") |
||
| Line 1: | Line 1: | ||
== Summary == | == Summary == | ||
| − | This file was produced by the following code: | + | This file was produced by the following Python code: |
<pre><nowiki> | <pre><nowiki> | ||
import matplotlib.pyplot as plt | import matplotlib.pyplot as plt | ||
Latest revision as of 13:41, 13 June 2024
Summary
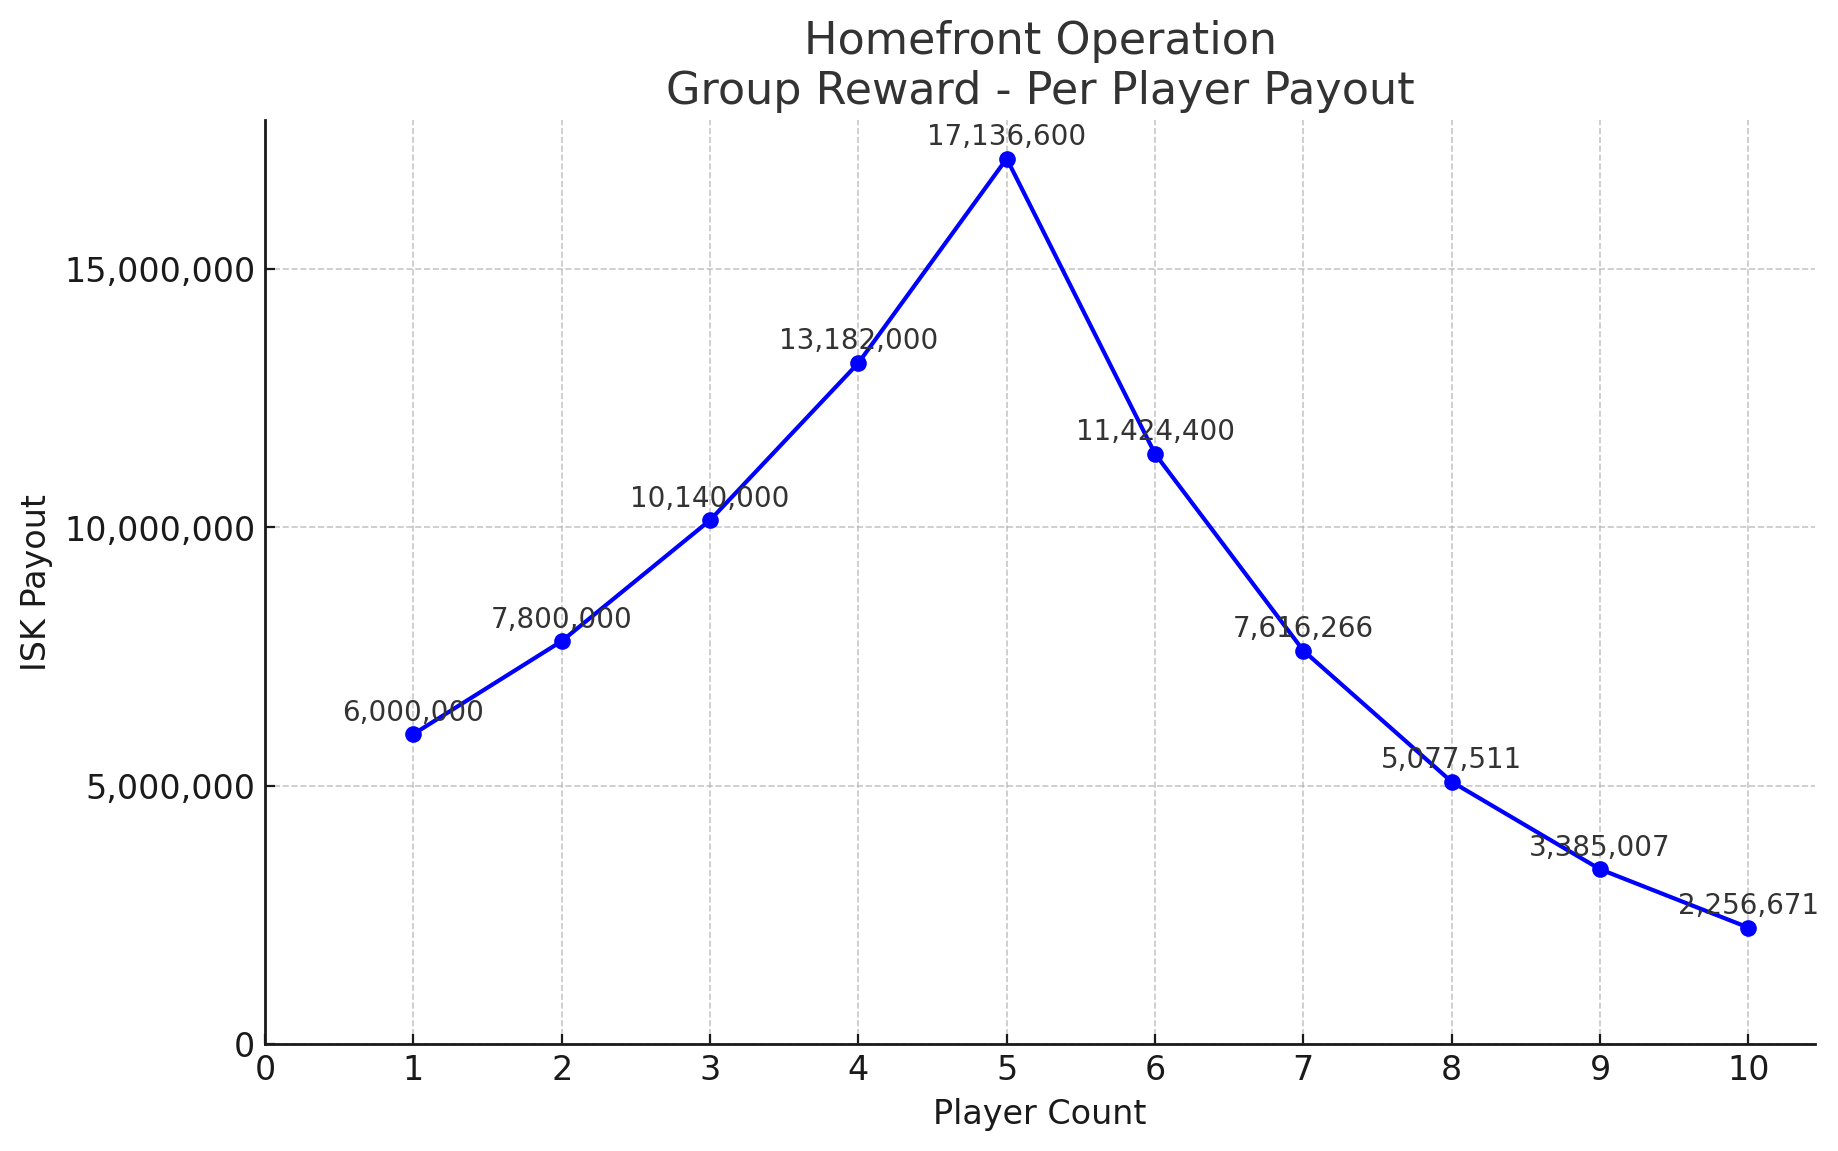
This file was produced by the following Python code:
import matplotlib.pyplot as plt
from matplotlib.ticker import FuncFormatter

# Data points
player_count = [1, 2, 3, 4, 5, 6, 7, 8, 9, 10]
isk_payout = [6000000, 7800000, 10140000, 13182000, 17136600, 11424400, 7616266, 5077511, 3385007, 2256671]

# Formatter function for y-axis
def millions(x, pos):
    return f'{int(x):,}'

# Create the plot
plt.figure(figsize=(10, 6))
plt.plot(player_count, isk_payout, marker='o', linestyle='-', color='b')

# Add labels and title
plt.xlabel('Player Count')
plt.ylabel('ISK Payout')
plt.title('Homefront Operation\nGroup Reward - Per Player Payout')

# Set the ticks
plt.xticks(range(11))  # X-axis: 0 to 10
plt.yticks([0, 5000000, 10000000, 15000000])  # Y-axis: 0, 5000000, 10000000, 15000000

# Apply the formatter to the y-axis
plt.gca().yaxis.set_major_formatter(FuncFormatter(millions))

# Add grid
plt.grid(True)

# Add data labels
for i, txt in enumerate(isk_payout):
    plt.annotate(f'{txt:,}', (player_count[i], isk_payout[i]), textcoords="offset points", xytext=(0,5), ha='center')

# Show the plot
plt.show()
File history
Click on a date/time to view the file as it appeared at that time.
| Date/Time | Thumbnail | Dimensions | User | Comment | |
|---|---|---|---|---|---|
| current | 08:10, 13 June 2024 | | 1,838 × 1,151 (142 KB) | Mednik Breau (talk | contribs) | This file was produced by the following code: <code><nowiki> import matplotlib.pyplot as plt from matplotlib.ticker import FuncFormatter # Data points player_count = [1, 2, 3, 4, 5, 6, 7, 8, 9, 10] isk_payout = [6000000, 7800000, 10140000, 13182000, 17136600, 11424400, 7616266, 5077511, 3385007, 2256671] # Formatter function for y-axis def millions(x, pos): return f'{int(x):,}' # Create the plot plt.figure(figsize=(10, 6)) plt.plot(player_count, isk_payout, marker='o', linestyle='-', c... |
- You cannot overwrite this file.
File usage
There are no pages that use this file.